KPI tree
Context
UX is not well positionned in the company
Quick fixes
Short time frame
Interesting methodology used here still.
Roles
UX UI Designer
Team
Kendall Roissetter: UX writer
Kendall's portfolio
Brief
Details:
Understand the impact of inflation
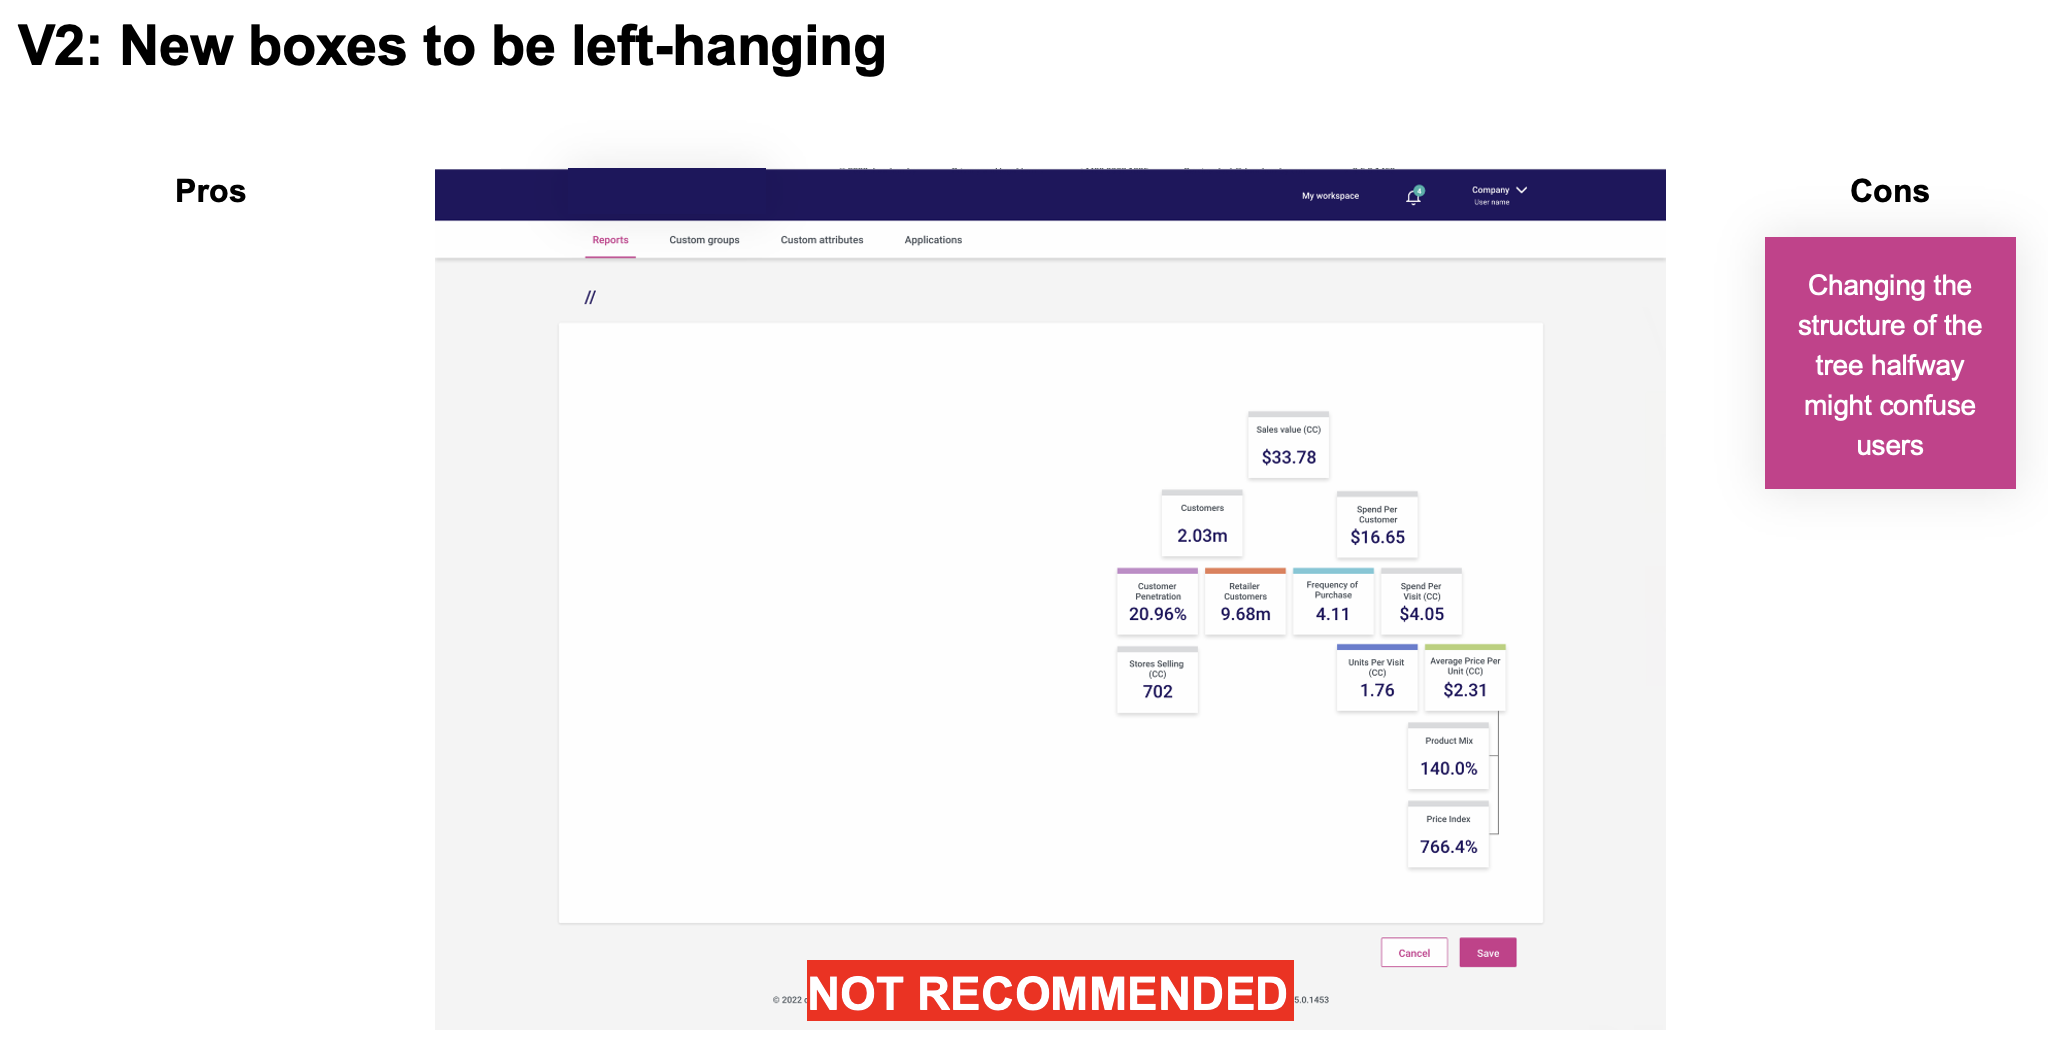
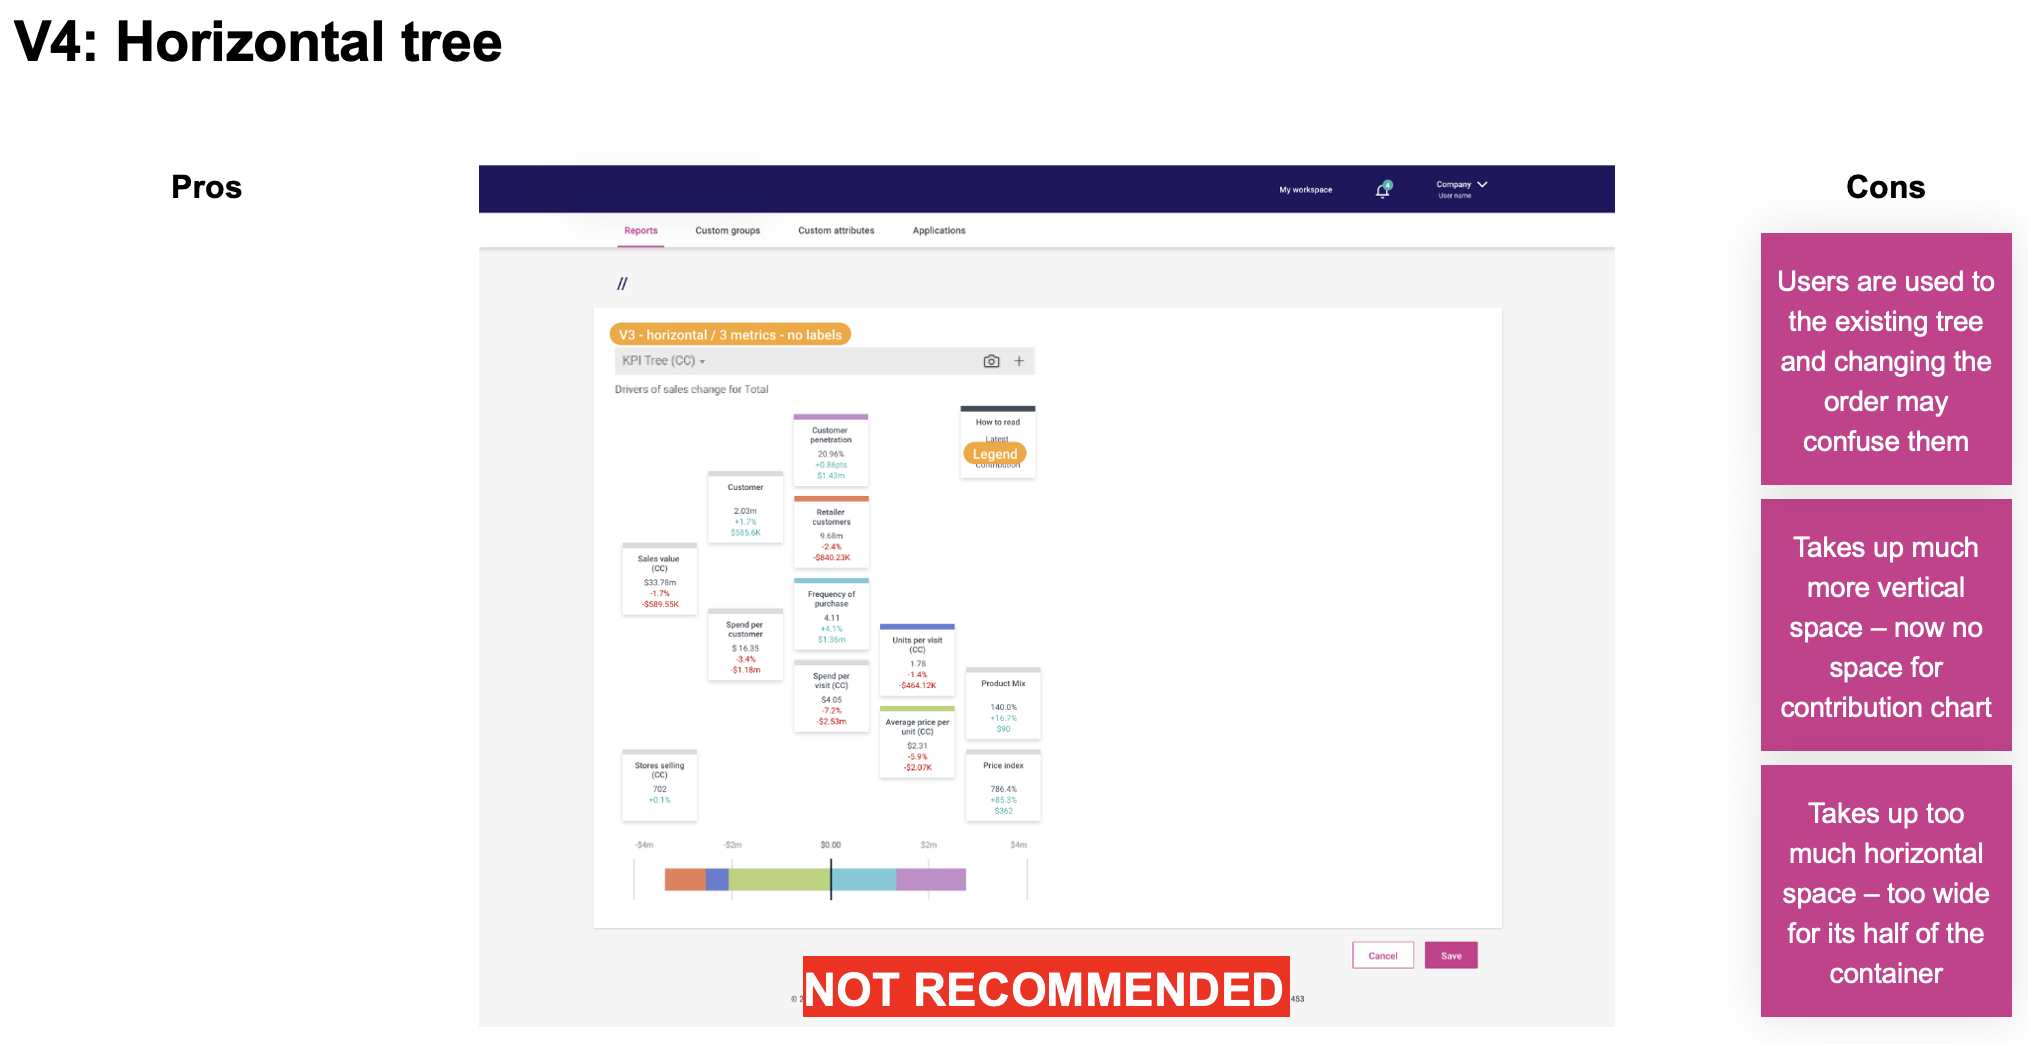
Existing proposal: add two new boxes onto the KPI tree
Constraints:
Tree boxes cannot be made smaller: accessibility
Requirements:
Urgent recommendation for how to fit new boxes onto the KPI tree.
Aha! tool example
Ideation
Group workshop faciltator:
All stakeholders: data analyst, product managers, data visualisation expert, engineer, UX writer, UX designer
Urgent need: every stakeholder came with a wish list and idea
Open and interactive ideation session: involve all of them in my UX state of mind
Make sure everyone has a say in the ideation - challenge with respect
Real time ideation: visualise ideas
Explain and embed them: understand discarding process


Ideation results
Everybody aligned with UX recommendation
Clear understanding from all parties
Short time frame survey: validate/ invalidate assumptions
User testing
Survey description:
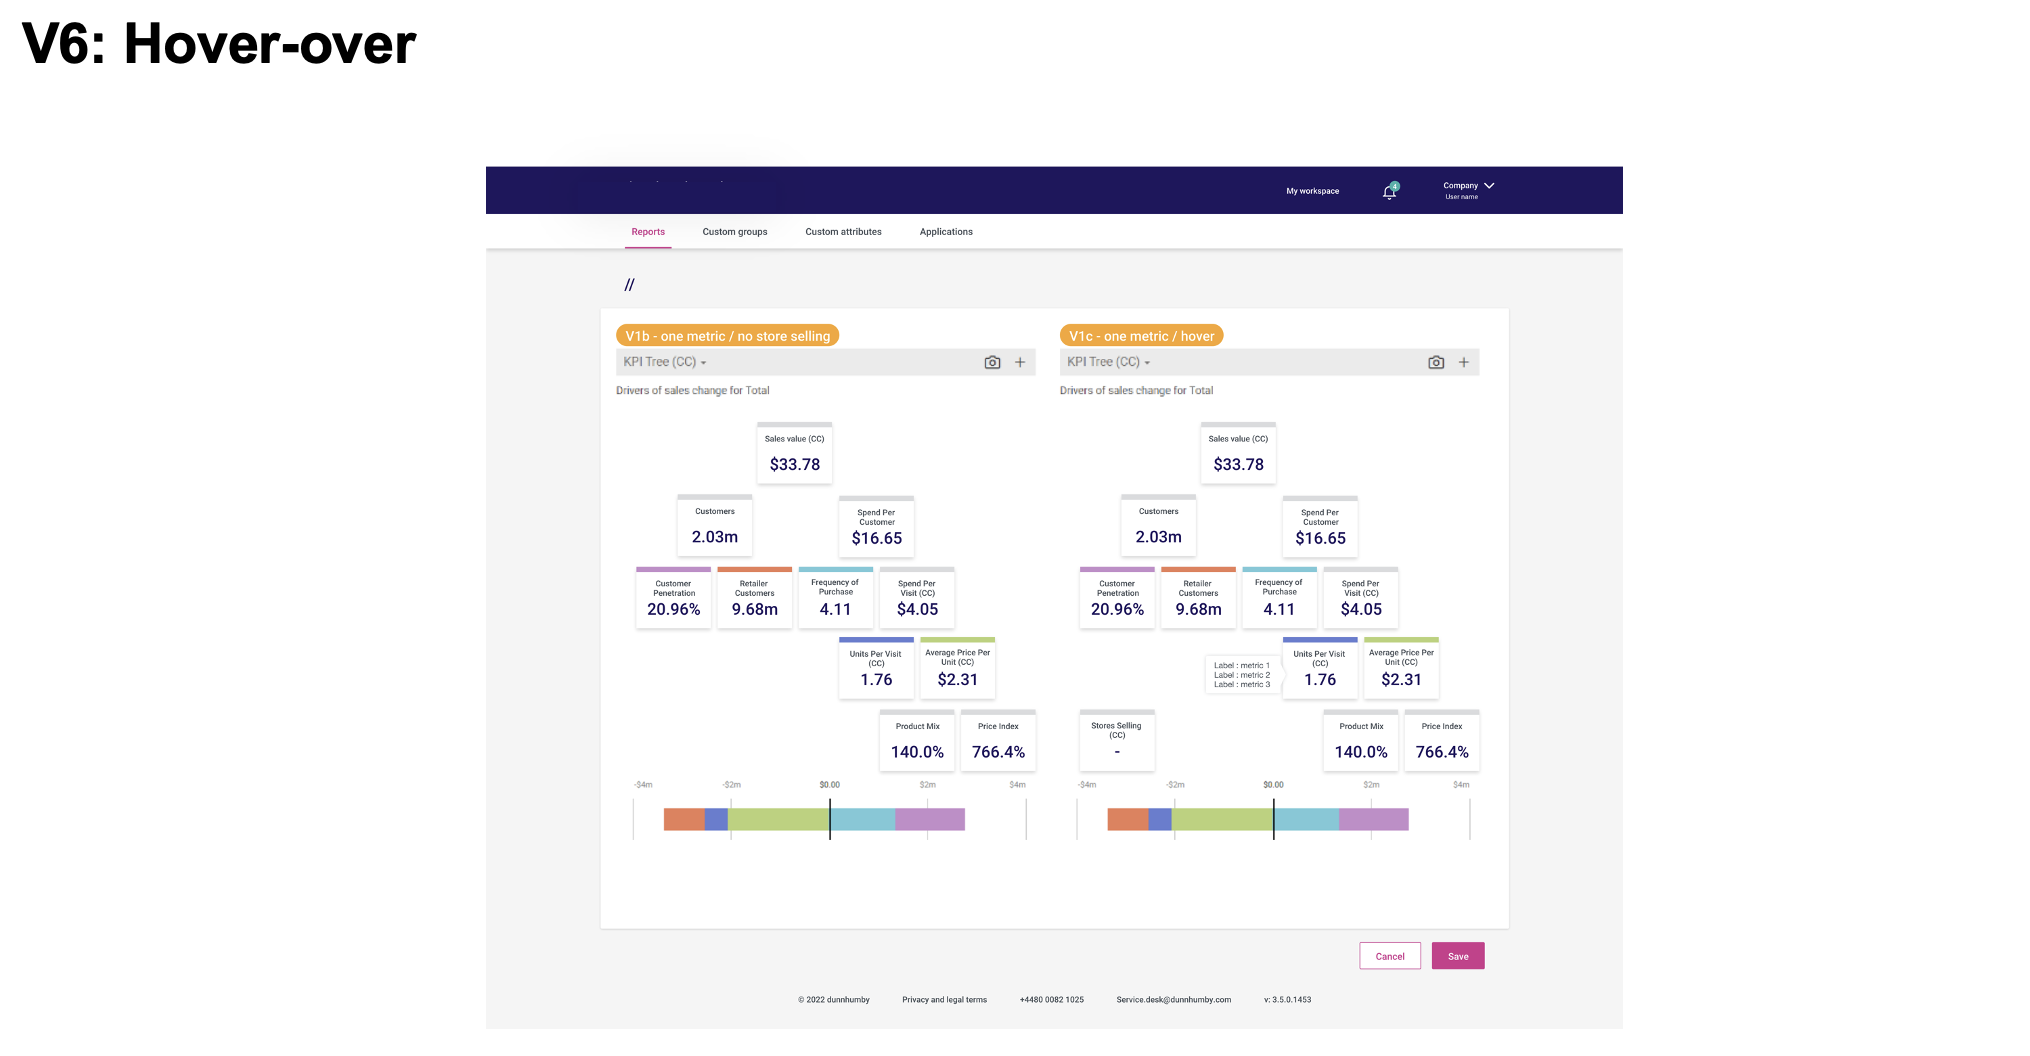
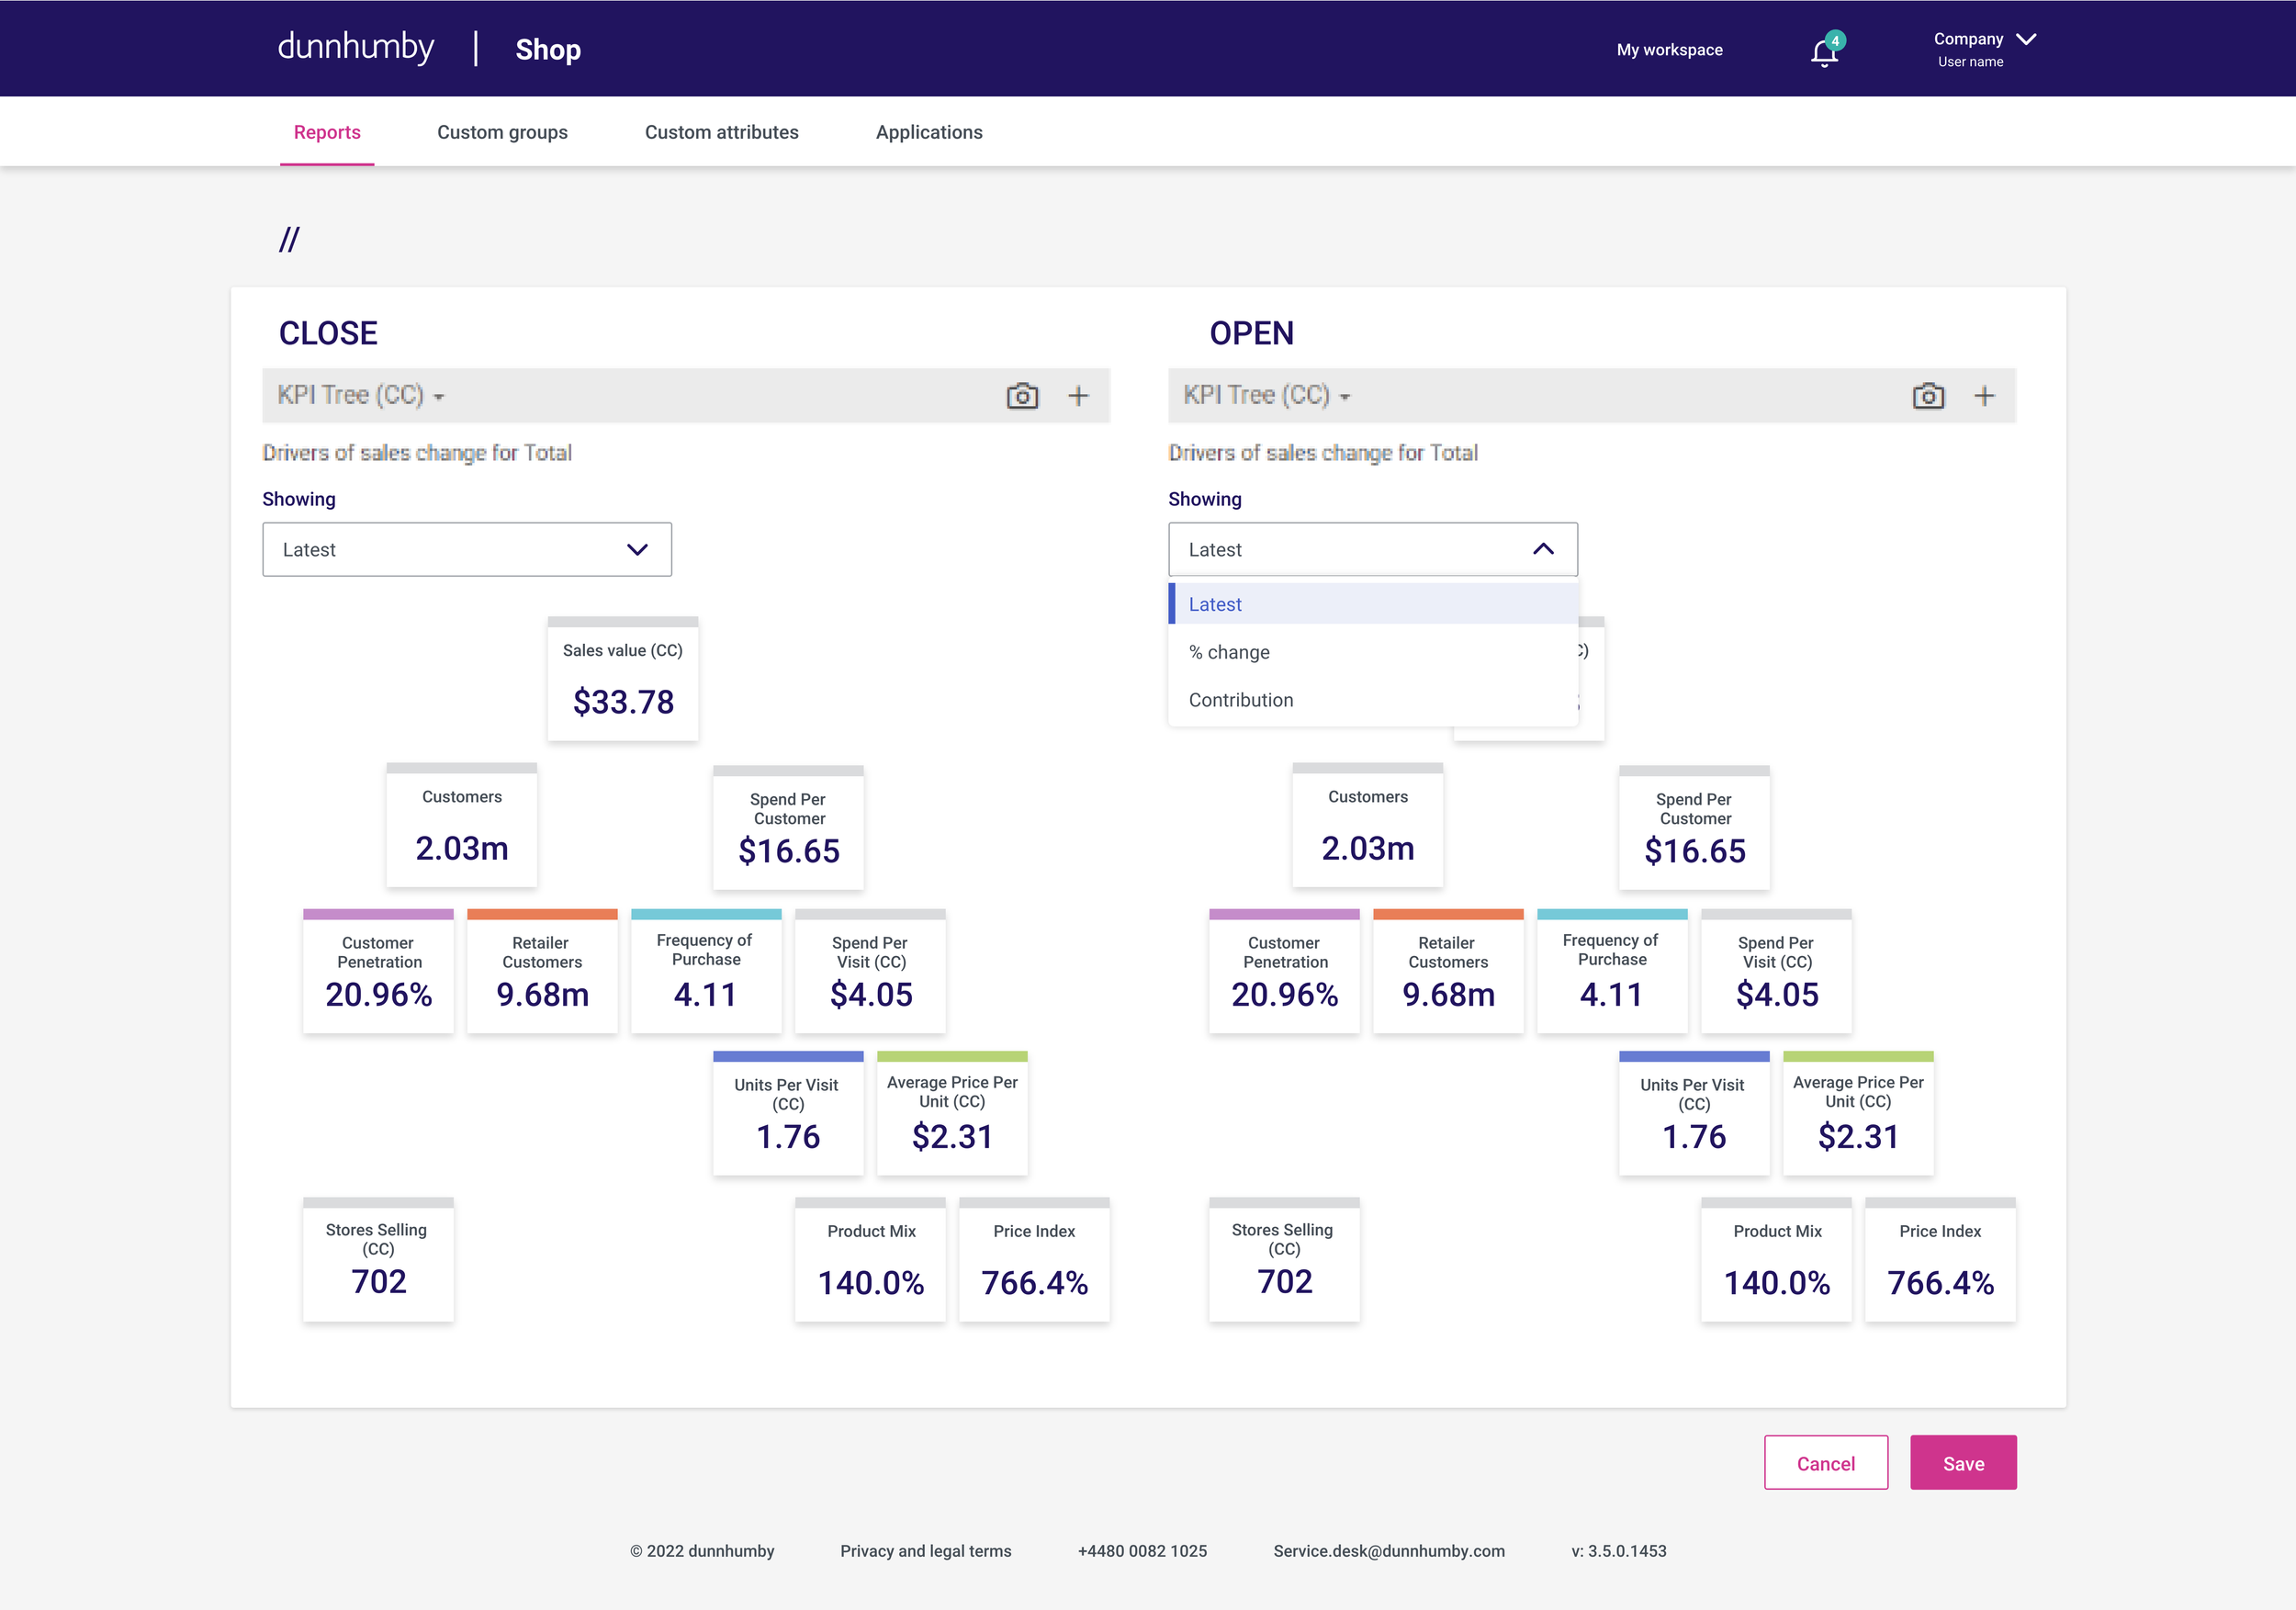
”We have been thinking about ways we could fit some additional boxes onto the tree to provide deeper insights. Unfortunately, due to space constraints, we need to redesign the KPI tree so that it meets our accessibility standards and is comfortable to read.
This KPI tree will not replace the existing one; it will be added as a new option in the drop-down.
One of the ideas we have had is to show only one metric in the boxes on the tree when it is collapsed. The expanded view would still show all three.”
Amongst the questions, 3 were particularly relevant to display here:
Question 1: How do you feel about this design?
The lowest rating this design received was 3 out of 5, and the highest was 5.
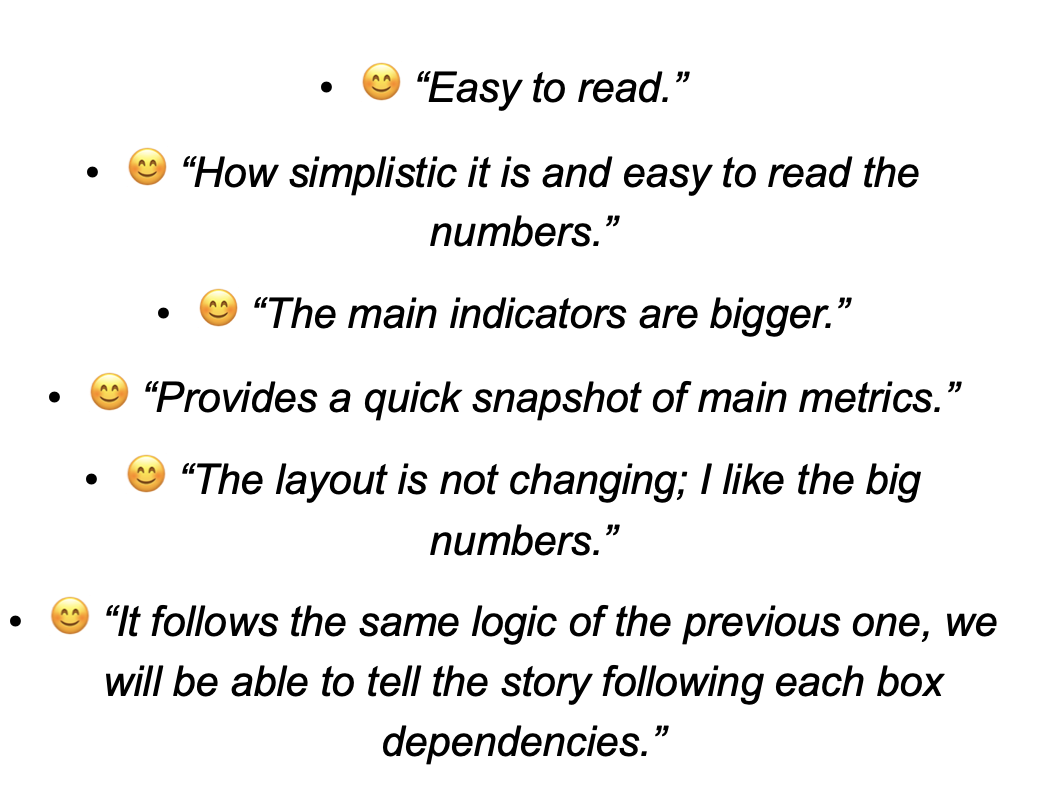
Question 2: What do you like most about this design?
Question 3: What do you most dislike about this design?
Three users said they liked having various metrics displayed on the tree and so disliked only being shown one.
However a 100% of our users were satisfied having the possibility to switch between the different metrics.
It is thanks to this collaborative approach that we have been requested by our stakeholders to animate a Ways of working presentation with all product managers, in order to explain the principle and benefits of UX: https://www.berenicelaboux.com/wow
SHOWCASED SKILLS
USER EXPERIENCE
USER RESEARCH
UX WRITING
#User Experience #User Research #UX writing